

MP3 Detection
INTRODUCTION
I found these informations on a very good page. You can check at http://members.optushome.com.au/mattboland/mp3bug.htm
When a wave file is encoded to MP3, the higher frequencies are discarded to achieve a file size up to ~1/10th the size of the original. This smaller file size results in less time downloading. The different bit rates refer to the amount of data required per second. That is, 96 kilobits per second for a 61 second song is 5856000 bits, which is equal to 732000 bytes.
Now, there are many many different encoders out there, each claiming to 'sound' better, or encode quicker etc. Using a poor DAC, using a sound card that resamples, analog transfers et al can all effect the 'sound' of an audio file. This page will be used to compare the visual representation of these audio files.
The following graphs are pretty self explanatory. I've used the same song as my test file. It was encoded to 96kbps, 128kbps, 160kbps, 192kbps, 256kbps and 320kbps constant bit-rate mp3 files. Variable bit-rate mp3 files were also created at 10, 50 and 100 values (where 10 is the lowest quality setting and 100 is the highest). These were created using MP3/mp3Pro fraunhofer IIs encoder via CoolEdit Pro 2.
I also transferred the song to mini disc and recorded at SP and LP2 modes using a Sharp MD-MT99W with ATRAC 3 compression.
The following graphs are the visual representations of the resulting audio files.
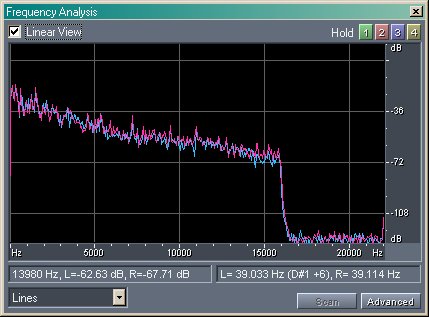
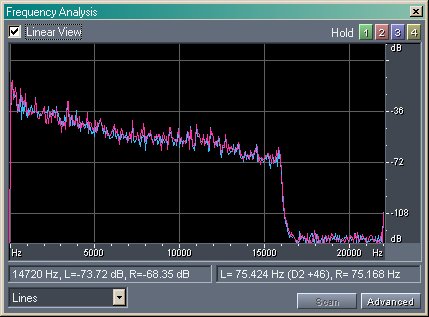
96 KBPS - 0.732 MB
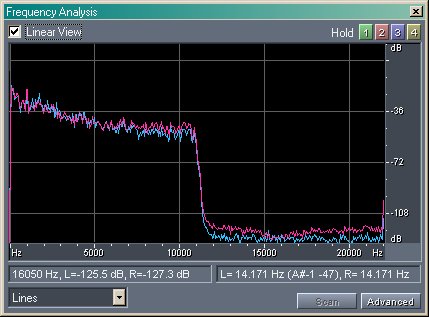
Notice sharp decline after 11KHz and not much after that
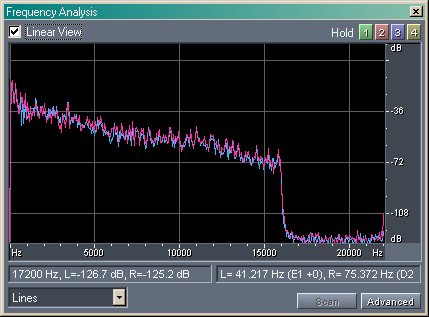
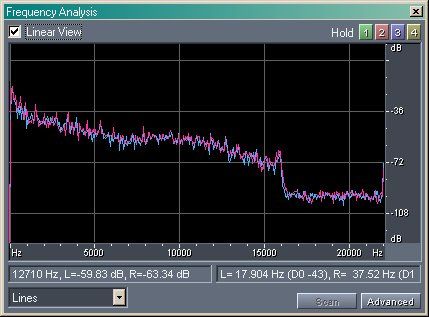
128 KBPS - 0.976 MB
Notice sharp decline after 16KHz and not much after that
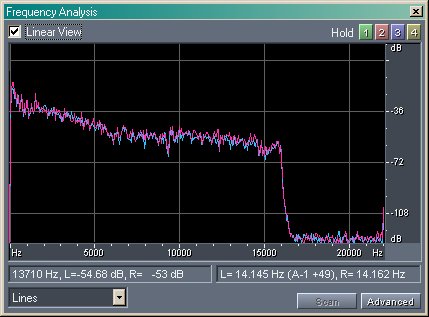
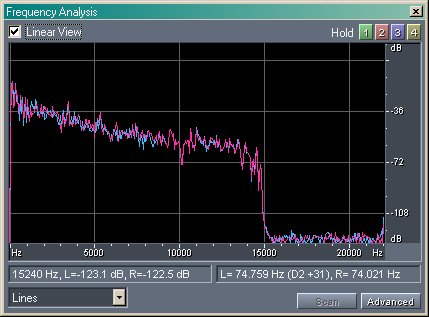
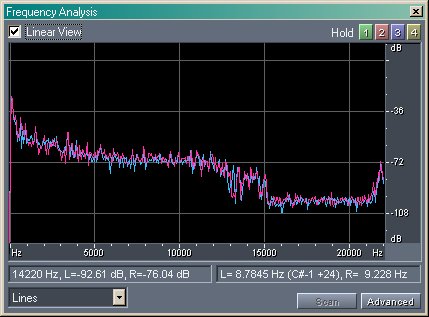
160 KBPS - 1.22 MB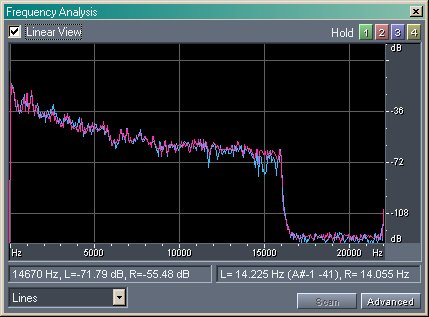
Notice sharp decline after 16KHz and not much after that
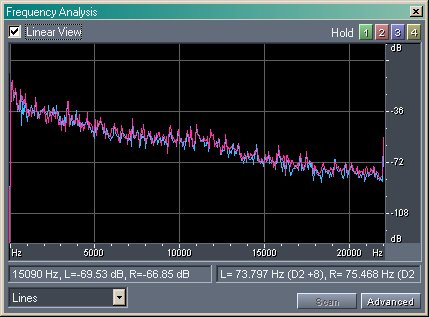
192 KBPS - 1.464 MB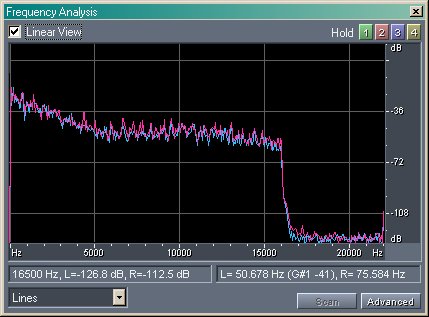
Notice sharp decline after 16KHz and not much after that
|
256 KBPS - 1.952 MB |
Notice sharp decline after 16KHz and not much after that
|
320 KBPS - 2.440 MB |
Notice sharp decline after 16KHz and not much after that
|
VBR10 - 0.724 MB |
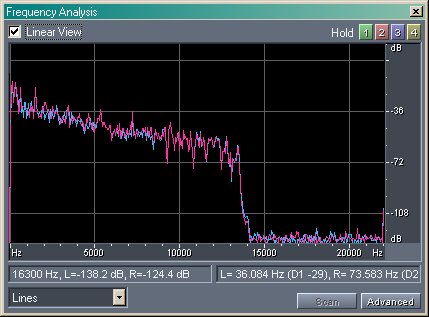
Notice sharp decline after 13.5KHz and not much after that
|
VBR50 - 1.003 MB |
Notice sharp decline after 15KHz and not much after that
|
VBR100 - 1.676 MB |
Notice sharp decline after 16KHz and not much after that
|
MD |
Notice sharpish decline after 16KHz yet not full cutoff
|
MDLP2 |
Notice bluntish decline after 15KHz yet not full cutoff as well as lower db from 20-15000Hz
|
UNCOMPRESSED WAVE FILE - 10.750 MB |
|
File |
Frequency cut-off |
Data after cutoff |
|
96 kbps |
11000 Hz |
< - 108 dB |
|
128 kbps |
16000 Hz |
< - 108 dB |
|
160 kbps |
16000 Hz |
< - 108 dB |
|
192 kbps |
16000 Hz |
< - 108 dB |
|
256 kbps |
16000 Hz |
< - 108 dB |
|
320 kbps |
16000 Hz |
< - 108 dB |
|
VBR10 |
13500 Hz |
< - 108 dB |
|
VBR50 |
15000 Hz |
< - 108 dB |
|
VBR100 |
16000 Hz |
< - 108 dB |
|
MD |
16000 Hz |
~ - 96 dB |
|
MDLP2 |
15000 Hz |
< - 96 dB > - 108 dB |
|
Uncompressed Wave |
none |
> - 84 dB |
Observing the frequency analysis of a song whilst playing, even an mp3, the values after the 'cutoff' may fluctuate, however these values are not a true representation of the file. In these images, I have chosen a specific point in the song where I can best determine the true file properties.